


How the NBA All-Star Game Became a Crap
The data behind how, when, and why the All-Star game started to suck


The NBA All-Star game has become a safe conduit to air grievances about the overall state of the league. Everyone agrees the event is rotten, and even if it’s uncouth, there’s no harm in kicking a corpse. However, many still view the NBA product in a favorable light. And, like a zombie Trojan horse, the All-Star game is a safe place to score cheap points (the only points Draymond Green has ever scored) about trying harder, playing defense, too many threes, and the general back in my dayisms that plague basketball discourse. While I vehemently disagree over the state of the game being in any form of peril, I wanted to see if the All-Star game is truly out of whack with historical norms, and if it is, when did we take a wrong turn?
To do this, I took every All-Star game in Basketball Reference’s database, starting with the 1951 event, and compared it to an average regular season game from that same season. I skipped this year’s game because the format diverged from a standard NBA game, and there was no All-Star game in the lockout-shortened 1998-99 season. Data collection was not nearly as sophisticated over 70 years ago, so I had to stick to the basics. I charted points (PTS), field goal attempts (FGA), field goals (FG), free throw attempts (FTA), free throws (FT), and then later 3-point attempts (3PA) and 3-pointers (3P) along with effective field goal percentage (eFG%), 3-point percentage (3P%), and true shooting percentage (TS%). I feel that these statistics provide a solid base for explaining the history of the All-Star game and should allow us to see when things went “wrong.”
My preferred method of comparison is the percent change of a statistical marker compared to the league average as opposed to the pure difference. The reason for this is to better normalize the improved quality of offensive play throughout the years. For example, if an average NBA game sees 100 points scored, then an All-Star game with 120 points scored is a 20% increase in scoring. However, if the average NBA game is 120 points, 140 points only represents a 16.7% increase in scoring. It’s the same difference, but not the same percent change.
Points
It should come as no surprise, but All-Star games see more points scored than an average game. As you can see from the chart below, in the early days of the league, scores more closely resembled that of an average game. In fact, we haven’t seen a game dip below the league average since 1972-73, and there has been a steady upward growth in the percent change between an All-Star game score and an average regular season game. On average, the All-Star game has seen a 25.32% increase in points compared to an average regular season game.

While the historical average percent change in points stands at only 25.3%, the All-Star game has consistently blown by this for decades. To better capture the changing scoring dynamics of the All-Star game, I broke it down decade by decade.

For the first three decades of the event, the All-Star game somewhat resembled an average game, but starting in the 1980s, that completely changed. In fact, the 80s saw by far the greatest percent change compared to the previous decade, the 1990s largely held serve with the established scoring change from the 80s, only for the 2000s and 2010s to post explosive growth.
From this data alone, it’s clear that the All-Star game’s scoring problem started at least over two decades ago. A likely reason why contemporary All-Star games feel so out of whack is that scoring has also risen substantially since 2000. The only sliver of hope for those who want the event to somewhat resemble a real game is that the 2020s have actually seen a slight decrease in scoring compared to an average All-Star game from the previous decade. The scores are still crazy town banana pants, but we may have already seen peak All-Star game tomfoolery, with the 2015-16 game representing a 79.65% increase in points compared to the league average.
FGA, FTA, 3PA, and True Shot Attempts
Why scoring rises can basically be boiled down to two factors: pace and efficiency. Even though scoring efficiency has reached an all-time high in recent years, pace can blow efficiency out of the water through sheer volume. In 2022-23, the league average offensive efficiency was 114.8 points per 100 possessions, leading to 114.7 points per game. However, in 1961-62, the league average offensive efficiency was 93.6, leading to 118.8 points per game. The difference in those two seasons was they played at a 126.2 possession pace in 1961-62 compared to 99.1 in 2022-23. You truly do miss 100% of the shots you don’t take.
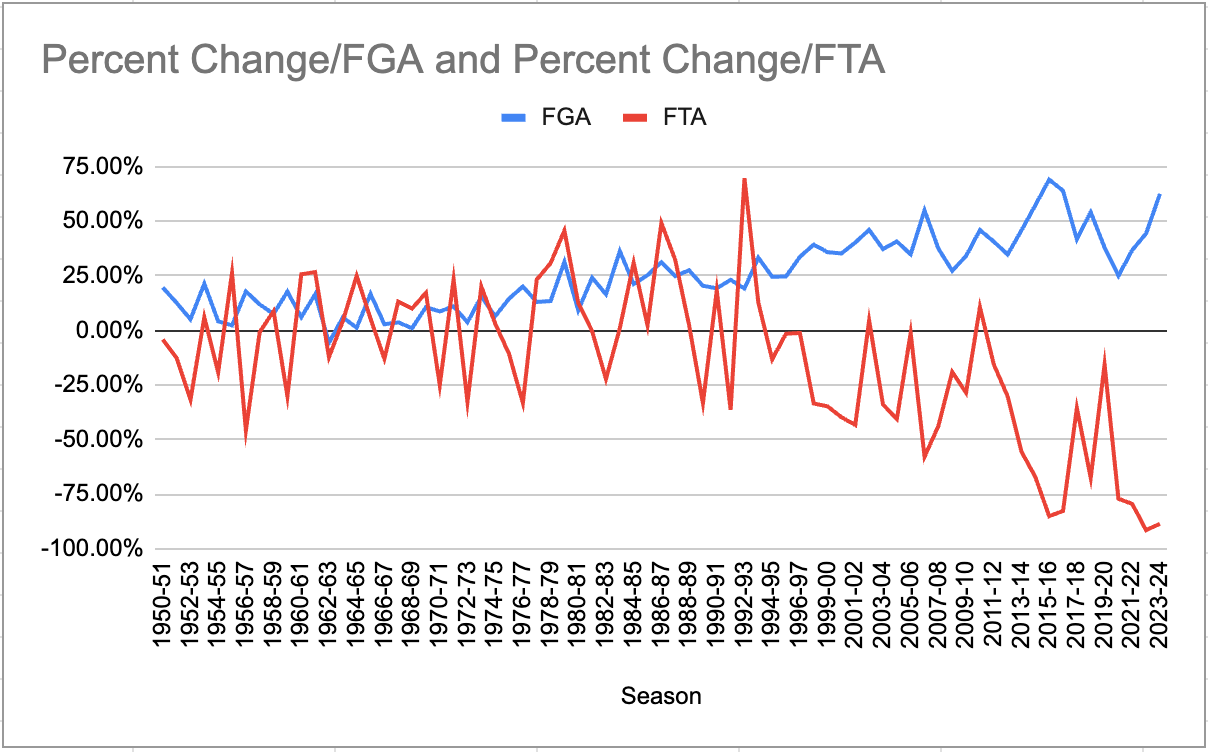
Similar to the trend in points scored compared to the league average, the All-Star game looked much more like a normal basketball game over its first three decades. However, the most telling trend, in my opinion, isn’t the steady increase in field goal attempts, but rather, it’s the decline in free throw attempts. As a general rule, free throw attempts are a decent proxy for defensive activity. A bunch of free throws doesn’t mean good defense is being played, but it does mean someone is trying to stop someone from doing something, which kind of sounds like defense.
The significant drop in free throws began in earnest in the early to mid-90s and has steadily decreased with occasional spikes. Now, the drop in free throws has also coincided with another hot-button basketball trend– the explosion in 3-pointers.
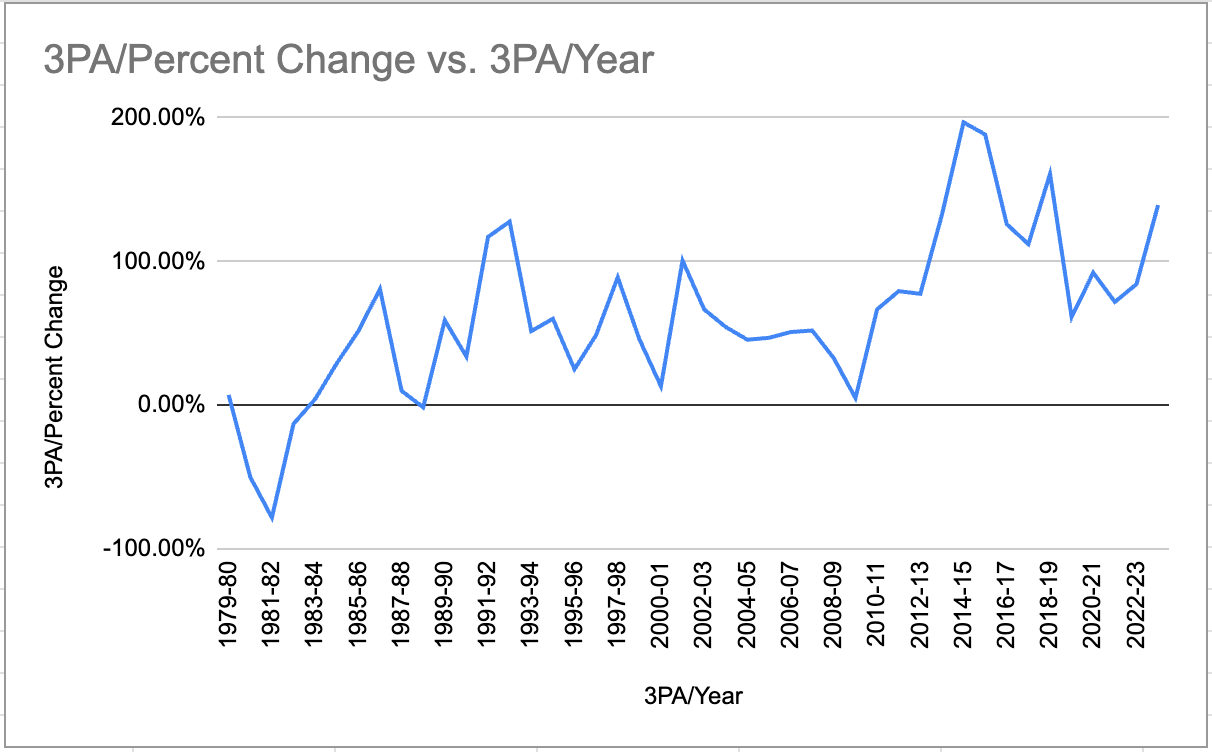
Unfortunately, we can’t go all the way back to the 1950s when analyzing 3-point data because the shot simply didn’t exist. But starting with the 1979-80 season, we can see that the All-Star game has been more 3-point happy than the average game. The real explosion in All-Star game 3-pointers occurred in 2013-14, which coincides nicely with the beginning of the Golden State Warriors dynasty that ushered in the age of the 3-pointer. However, after a massive spike in 2014-15 and 2015-16, the percent change has leveled off substantially. The only problem is the league average 3-point attempt rate has only continued to grow. In 2013-14, a crazy amount of threes in the All-Star game was an exciting novelty, but ten years later, it feels like too much of the same.
The final bit of shooting volume data I want to present is likely the most important. As illustrated before, shot volume can lead to points better than shooting efficiency, and the All-Star game has always seen an uptick in shot volume. However, due to prior All-Star games having an insane amount of free throws, 1955-56 saw 96 total free throws and 1986-87 saw 91, field goal attempts don’t fully capture the picture. In order to estimate how many actual shot attempts there were, I used the true shooting percentage weight of 0.44 per free throw attempt to calculate the number of true shot attempts.

The linear correlation between true shot attempt percent change and points scored percent change between the All-Star game and the league average is an impressive 0.8897. Simply put, All-Star games are generally played at a faster pace than an average game, and that, historically, explains most of the scoring increase. However, an interesting insight arises within this chart. Yes, players in recent years have gotten up more shots relative to the league average, but the difference is far less pronounced than the explosion in scoring.
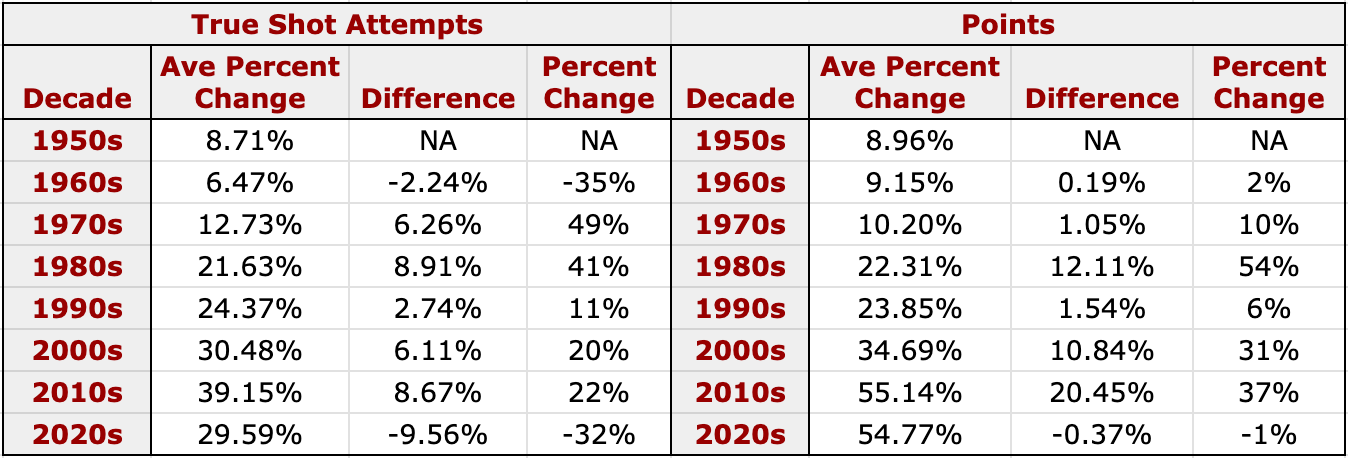
Over the first five decades of the All-Star game, the average percent change in true shot attempts generally grew in lockstep with the average percent change in points scored relative to the league average. However, that relationship started to diminish over the past three decades and, in particular, over the past two.
Efficiency
The final piece of the All-Star game puzzle is shooting efficiency. Looking at the change in effective field goal percentage (eFG%) and true shooting percentage (TS%) relative to the league average shows how, despite the growth in pace of the game leveling off, scoring has continued to increase.

The general trend of the All-Star game becoming more and more of an offensive showcase wasn’t as apparent in the eFG% data until the 2000s. Between 1950-51 and 1997-98, an average All-Star game only saw a 2.01% increase in eFG% compared to the league average. However, since then, that figure has ballooned to 15.78%.

The TS% data tells a similar story. Generally, All-Star games saw TS% that were similar to the league average up until the 2000s, and then in the 2010s, things really started to go off the rails. Is this all down to ambivalent defense? Well, to a degree, but not completely.
A real factor is improved shot selection. At the beginning of the 3-point era, players were so inept at shooting threes that they were, on average, a less efficient shot than a two. However, that quickly changed, and by the 90s, threes were the more efficient shot. This change coincided with the increase in 3-pointers league-wide and in All-Star games, and you have a recipe ripe for the growth of All-Star game eFG% and TS%.
Summary
There is significant statistical evidence that the All-Star game, over 74 iterations, has come to resemble an average NBA game less and less. What is also clear is that this trend largely started in the 1980s and has continued to the present day. Just take a look at the percent change year to year of the points scored percent difference from the league average in the 3-point era (1979-80).

This is a fantastic example of the powers of compounding interest. If you invested in a stock in 1979-80, and over the next 40 years, you saw steady 10% growth, combined with general inflation, that stock would look incredible. However, the overall behavior of the stock wouldn’t have changed all that much from the day you invested, even though the value would have exploded over the past 10 years. This is how you go from an average of 140 points in the 1980 All-Star game to 159 in 2013-14 to 198.5 in 2023-24.
The All-Star game’s problems didn’t start with this generation of players, but they didn’t do anything to ease the continuous trudge of enshittification and largely rode the same train their predecessors did. The question is, why did that happen? I think a few things are clear. The first is that basketball is an offensive-leaning sport. Compared to soccer, baseball, and hockey, it’s a lot easier to score a basket than a goal or run. This basic fact of the sport has seen the general improvement of offensive efficiency throughout the league’s history. As such, it shouldn’t come as a surprise that bringing the best players in the world together for an exhibition leads to some truly wonky scorelines.
The second observation is that All-Stars today are significantly better than before. Back in 1950-51, ten teams made it through the season alive. The All-Star game simply represented more of the league’s population, and thus, it contained a lower quality of player. Also, if you compare players today to players in the 1990s with clear eyes, you’ll quickly realize that some of these All-Stars from yesteryears would be in the G-League today. Offense is better now than it was in the 90s because the players are better at offense, not because guys stopped trying or playing defense. It’s beyond insulting how many people so adamantly and casually throw those types of claims around.
My final observation is that players have followed in the footsteps of their predecessors and each subsequent generation has cared just a tad less about trying in the All-Star game. So yes, players today try less hard to make the All-Star game look like a real game than anyone before them, but that’s true for All-Stars throughout history. It’s like a boomer blaming a millennial for climate change. Like sure, but also, get bent.
The problem is we’ve reached a critical mass of talent, not caring, and general league offensive trends to produce a 200-point game. However, the trends that have led to this convergence have been there for decades. Asking the All-Stars of today and tomorrow to reverse 40 years of decline seems a tad unfair, and unless it’s the Big O or Kareem, I don’t want to hear from anyone who played during or after the 1980s about the All-Star game. You got us on and kept us on this death march.
None of this research was groundbreaking or revelatory, but I think it does a satisfactory job of illuminating why the All-Star game has become a punching bag. The game truly has become unrecognizable in comparison to a normal NBA game. The increase in scoring is due to less defensive intensity, more pace and efficiency, and has only been amplified by the league entering an offensive golden age. There may be ways to save the All-Star game, but one thing is clear, it needed saving decades ago, and now, it might be too late.
For any inquiries about work, discussion, and the like, you can email me at nevin.l.brown@gmail.com.
Great article!