


The Anatomy of an MVP
The data behind an MVP, and where the award is heading


As the NBA drags its feet on announcing the Most Valuable Player of the 2024-25 regular season, it’s as good a time as ever to look at what an MVP looks like, what wins the award, and the changing trends of what voters value. But first, a quick history of the NBA MVP.
NBA MVP Cliff Notes
In 1980-81, the league stripped the players of the prestigious duty of selecting the MVP and gave it to the media, which is the system we still have today, and will be the starting point for all our data and trends. To be completely honest, outside of Dave Cowens in 1972-73 and Wes Unseld in 1968-69, the players did a pretty good job, and even those two were no doubt Hall of Famers.
The number of media voters grew steadily from 69 in 1980-81 to a maximum of 131 in 2015-16, and has since hopped between 99 and 101. The stark drop after 2015-16 came when the league stripped local broadcasters of their MVP votes. From 2012-13 to 2020-21, the NBA included a single ballot voted on by the fans. The league thought better of the practice when Derrick Rose received a first-place vote in 2020-21 from the fans in a season where he averaged 14.7 points per game in 50 games and only three starts.
The most consequential change to NBA voting practices in recent memory was the decision to publish voter ballots in 2013-14. With the loss of anonymity, the number of individual players on ballots declined below the historic norm, although the trend towards more voting homogeneity has been present since the beginning of the media voting era, and may actually be reversing.
The Anatomy of an MVP
Starting with the basic box score stats, since 1980-81, the MVP has averaged 27.1 points, 6.3 assists, and 9.0 rebounds per game on an adjusted effective field goal percentage (eFG%+) of 108.7 and an adjusted true shooting percentage (TS%+) of 110.8. 100 is the league average, 101 is one percent above the league average, and 99 is one percent below the league average. (Example: League average eFG% = 50%, an eFG%+ of 101 equates to an eFG% of 50.5%)
The correlation between scoring and winning the MVP is much higher than generating assists and rebounds. 12 out of 44 MVPs have led the league in points per game, while only three have won the assists or rebounds per game title. The lowest points per game of an MVP is Steve Nash’s 15.5 in 2004-05, while the lowest assists per game was Moses Malone’s 1.3 in 1982-83, and the lowest rebounds per game figure was again Nash in 2004-05 with 3.3.
When it comes to advanced metrics, in this case, win shares, value over a replacement player (VORP), and their rate brethren, the average MVP, unsurprisingly, grades out incredibly well. On average, an MVP has finished with 15.8 win shares, 0.264 win shares per 48 minutes (WS/48), 8.1 VORP, and a box plus/minus (BPM) of 9.1. These figures are almost identical to Magic Johnson’s first MVP season in 1986-87 when he produced 15.9 win shares, 0.263 WS/48, 8.0 VORP, and 8.8 BPM. 25 MVPs have led the league in win shares, 26 in WS/48, 24 in VORP, and 25 in BPM. Leading the league in all four categories has been an incredibly strong predictor of MVP success. Since 1980-81, there have been 25 individual seasons where a player led the league in each of win shares, WS/48, VORP, and BPM, and 18 times they’ve won the MVP, good for a 72% success rate. However, on three occasions, Nikola Jokic in 2022-23, LeBron James in 2010-11, and Michael Jordan in 1992-93, a player was denied a third consecutive MVP despite the analytics grand slam. The other four seasons are three Jordan seasons (1988-89, 1989-90, and 1996-97) and David Robinson in 1993-94.
From a team perspective, the average MVP has come from a team with a 73.9% win percentage (a 60.6 win pace) and a net rating of +7.1 (a 72% expected win percentage, give or take pace of play). 27 MVPs (61.36%) have led the team with the best record in the league, and a whopping 34 MVPs (77.27%) were on the team with the best record in their conference. Interestingly, only 15 MVPs (34.09%) came from the team with the best net rating in the league. Suggesting an element of luck in winning the award. Out of all the statistics I looked at, none has been better at predicting the MVP than being a one seed in the playoffs, but that may be changing.
Exploring Trends in MVP Voting
Basketball is Poetry did an excellent piece on the dying diversity in MVP voting. And while the trend of more lopsided voting results with fewer and fewer players receiving votes is true, I don’t think it’s a particularly modern trend, nor a serious problem. This chart shows how the diversity of ballots has trended down since the very beginning of the media voting era, as fewer individuals are receiving first-place votes and/or down-ballot support.

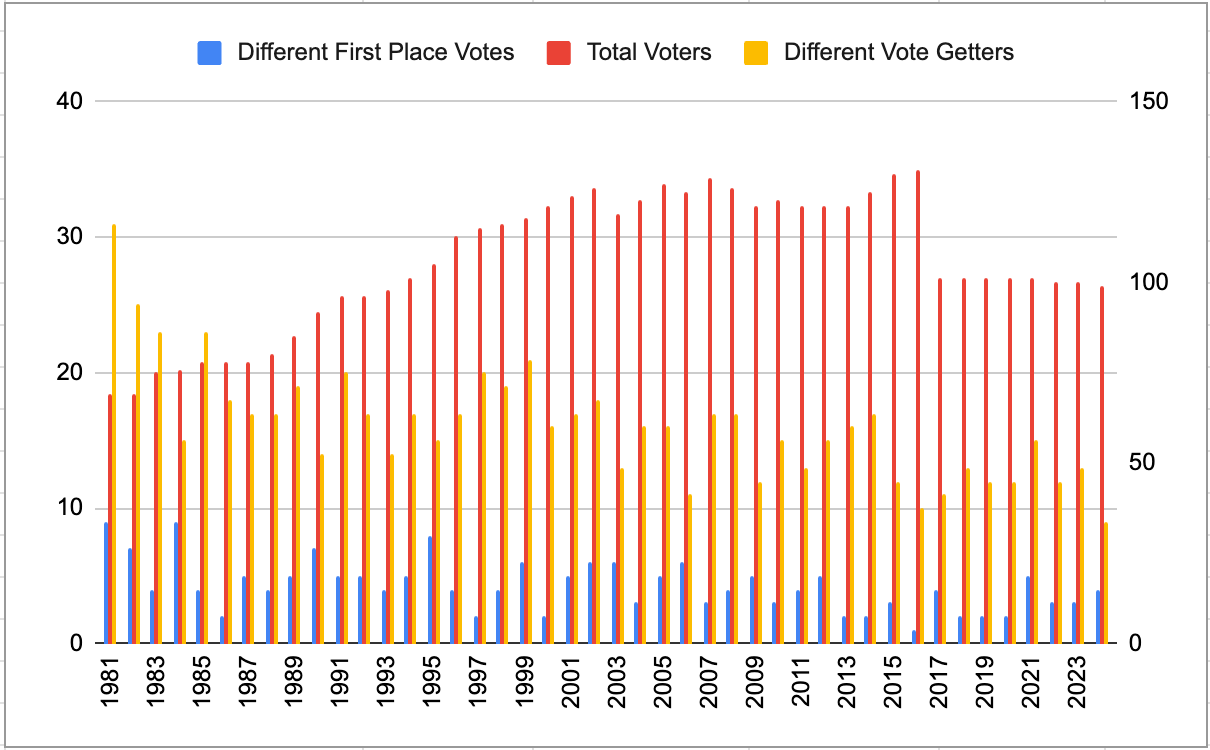
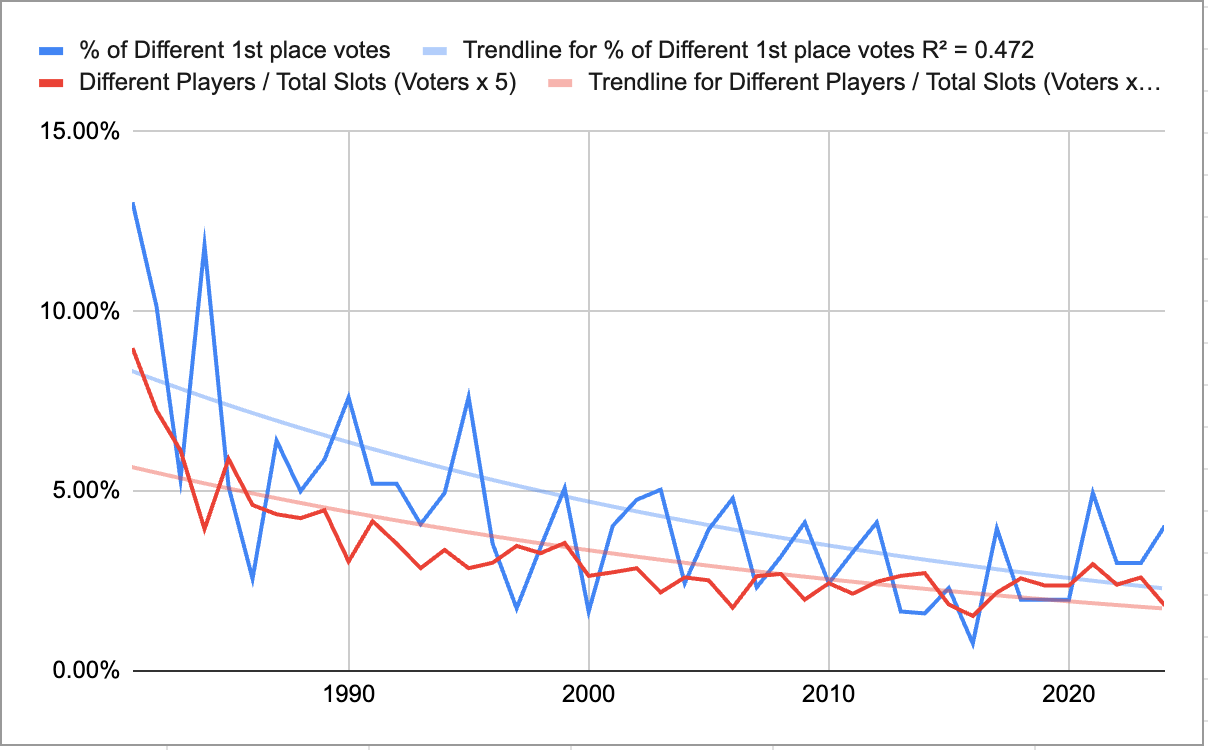
Now, the raw totals of different first-place and overall votes look much more static in the early goings, but that was due to the rapidly expanding voter pool, and then the sudden culling of 30 votes in 2015-16 made it look like diversity fell off a cliff. If we look at the percentage of votes going to different candidates, it’s clear that MVP voting has continuously gotten more selective since the beginning.
Interestingly, ballot diversity appears to be rebounding from a low point in the mid-2010s. As a result of ballots becoming either more selective or similar, the gap between the first and second place MVP point shares has increased substantially in recent decades.

While Basketball is poetry pegged the introduction of Twitter in 2006 as a catalyst for MVP groupthink, I think there’s a simpler explanation. As modern Americans are all too aware, not all candidates are created equal. From 2001 to 2008, we had one of the weakest crops of top-end MVP candidates, but from 2009 to the present, we’ve had a bumper crop.
Using data from the Anatomy of an MVP section, I created a simple, but relatively predictive, MVP metric called Core First Place Finish Percentage. The ten core metrics are team record, team net rating, conference record, win shares, WS/48, offensive win shares, VORP, BPM, offensive BPM, and points per game. A player is only awarded a point if they finish first, and the metric is just the percentage of first-place finishes the MVP secured that season.

It’s not a perfect correlation, but generally, the higher an MVP’s Core First Place Finish Percentage was, the larger the gap they produced over second. As you can see, there is a lull in truly transcendent MVP seasons between Shaquille O’Neal in 1999-00 and LeBron James’ first MVP in 2008-09. However, following that fallow period, the voters were served a continuous dish of can’t-miss candidates.
It was hard for voters to miss that prime-LeBron was a slam-dunk MVP candidate, and his five-year reign was followed by an All-Time season from Kevin Durant, then two sublime seasons from Stephen Curry, Russell Westbrook averaging a triple-double, peak-James Harden leading a 65-win Rockets team, then back-to-back Giannis Antetokounmpo masterclasses leading into the Nikola Jokic era. Outside of Derrick Rose and Joel Embiid, the voters have been presented with and picked the clear-cut MVP.
A big part of me believes that MVP voting homogeneity is a representation of candidate quality more than anything else. That doesn’t mean there isn’t any groupthink, but outside of the weird belief that no one should win three straight MVPs, the voters have generally shown overwhelming support for the pretty obvious candidates.
The final trend of note is the possible decline in the importance of team success. Four of the past eight MVPs have come from teams that did not lead their conference in wins. Prior to that run, 83.3% of all MVPs were on a team that won their conference. However, I wouldn’t make too many proclamations over the change in voter tendencies just yet. One of those was Westbrook averaging a triple-double for the first time since the triple-double was coined. Another two were Jokic seasons where he led the league in win shares, WS/48, BPM, and VORP by comical margins. And the fourth went to Joel Embiid, who probably didn’t deserve the award, but he was the clear next-best candidate to Jokic, who would have won a third straight MVP, which apparently isn’t allowed. Needless to say, three out of the four MVP winners from non-conference winners came in historically anomalous statistical campaigns.
So, what’s the anatomy of an MVP? It’s the league’s best player on the league’s best team. If those two distinctions don’t overlap, then it’s someone close to the top in one and at the top in another. The drift towards voter homogeneity could be viewed as a troubling development, but I think it’s a testament to the growing intelligence of the voter pool. There’s a reason academics tend to agree on most things. The most interesting trend, to me, is the possibility that voters are weighing player metrics more heavily than team success. I still need more evidence before I say that is definitely what we’re seeing, but it would represent a significant change in how voters view the award.
For any inquiries about work, discussion, and the like, you can email me at nevin.l.brown@gmail.com.
🔥🔥🔥🔥🔥
Great article!